Retention is the bedrock on which organic growth is built. An engaged exhibitor is a happy exhibitor, and a happy exhibitor rebooks. Until now, the evidence, for that has been empirical and anecdotal. New data from Grip, covering 166,359 exhibitor company-editions across 568 show cycles and 89 organisers, puts numbers on it for the first time at portfolio scale.
Fix your churn to fuel your growth
Organic growth in an exhibition business has three main levers: exhibitors who return, exhibitors who are new, and more revenue from each in terms of price increase or new products sold. Retention is the one thing everything else is built on.
If you've ever seen a waterfall chart, you know how this looks. Start with 100 of revenue. Churn takes 20, leaving a retained base of 80. A 5% price rise on that base adds 4. Let's say your new business team only replaces the lost 20% at the new price, adding 21. Presto: you are in 5% growth.
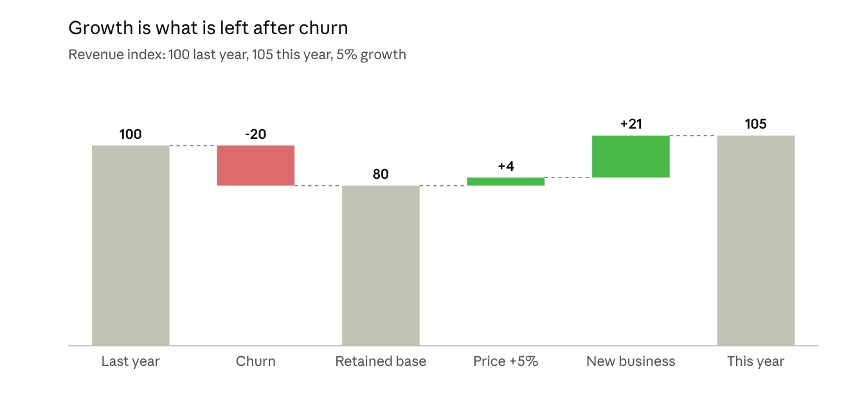
Illustrative revenue index, last year = 100
Note where the growth came from. Assuming new business only refills the bucket, price does the rest.
Now let's halve churn to 10% and keep the same price rise and new business output as above; this scenario delivers 15.5% growth.
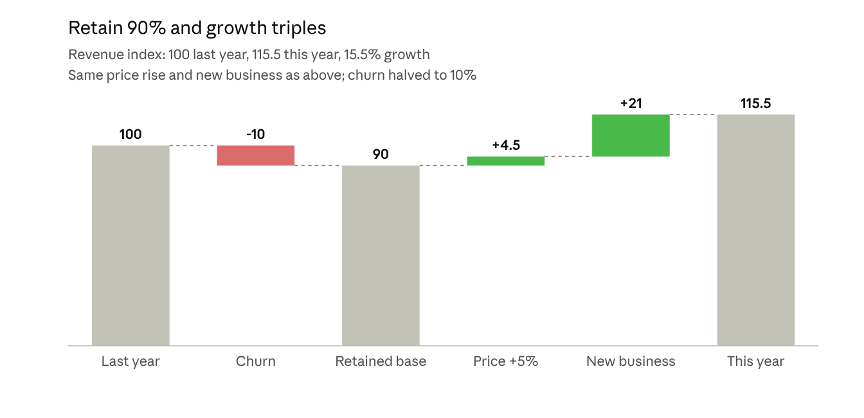
Illustrative revenue index, last year = 100; 90% retention
Halve churn and growth triples. The difference is not more selling. It is fewer exhibitors walking away.
CEIR's 2026 benchmarks put exhibitor company retention at 73% for smaller US shows, 78% for midsize and 69% for the largest. The typical show therefore replaces between a fifth and a third of its exhibitors every year just to stand still.
Replacement is expensive. As Harvard Business Review reports, Bain's Frederick Reichheld found that a 5% increase in retention lifts profits by 25% to 95%, and winning a new customer costs five to 25 times as much as keeping one.
Exhibitions add a twist to this: the customers new business brings in are the least likely to stay. Just look at your Y1 (first-time exhibitor) churn numbers. (if you haven't... You might want to sit down for this one). Across Grip's portfolio (more below), only 36% of first-time exhibitors returned the following year, against 70% of repeat exhibitors. You read that right, a 2X difference.
This is one of the key reasons why investors like the B2B events model. For well-established shows and serious organisers, rebookings of over 100% are not miracles. On 30 July 2026, Informa reported commitments for around 90% of Informa Markets' full-year exhibitor revenue at the half-year.
What drives retention? What we already knew, and how we knew it
I have seen it many times over: an engaged exhibitor is a happy exhibitor, and a happy exhibitor rebooks. The exhibitor with a full meeting diary signs on the floor. The one who stood on a quiet stand for three days goes silent when the renewal arrives. Every sales director knows this pattern.
The evidence, though, (as is customary for our industry) has been empirical and anecdotal at best. What has been missing is a large behavioural dataset that links what exhibitors did at the show to whether they came back.
Enter: the Grip study
My good friends at Grip, the London-based event networking and matchmaking platform, have now built that dataset, crunched it, and kindly gave me early access to the insights they derived. They analysed four years of exhibitor data across their portfolio: 568 completed show cycles, 89 organisers, and 166,359 exhibitor company-editions, from September 2022 to September 2026. No company, event, or organiser is named, but still a goldmine. You can download the report here
The method is simple. Grip summed each exhibitor's meetings held, connections, badge scans made and received, and profile views received, then ranked exhibitors against others at the same show. It then checked whether each exhibitor appeared at the next edition. Everything the model uses is known on the last day of the show. Here are its core findings:
1- Engaged exhibitors come back
The more attention an exhibitor attracts at the show, the more likely it is to return, for first-timers and repeats alike.
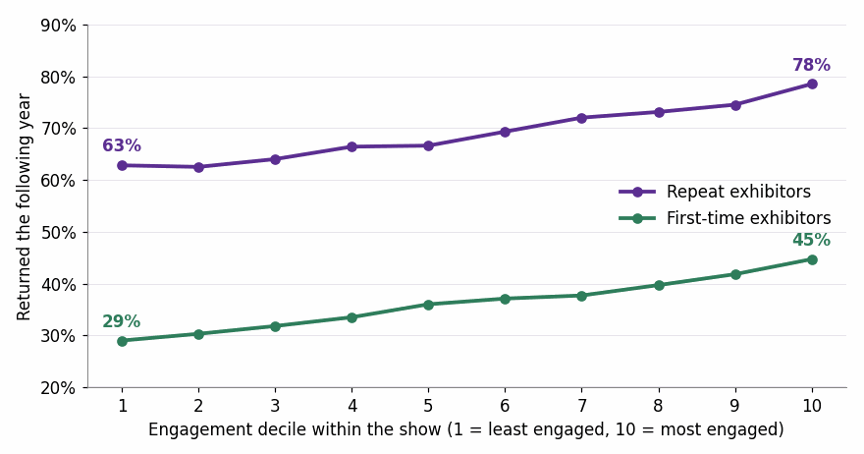
Return rate by engagement decile within the show. Engagement = meetings held, connections, badge scans made and received, profile views received. Chart: Grip.
First-timers in the least engaged tenth of their show returned at 29%, those in the most engaged tenth at 45%. For repeats the range is 63% to 78%. The lines rise at almost every step and never cross. There is no threshold to clear and no ceiling.
The effect is sharper where exhibitors use the platform in earnest. On high-use shows, first-timers range from 20% to 50% retention, a 2.5x difference, and repeats from 53% to 81%. Put as churn, a repeat exhibitor in the bottom 60% of its show is 1.4 times as likely to leave as one in the top 40%.
Combine engagement with exhibiting history, and every exhibitor falls into one of nine bands on the last day of the show.
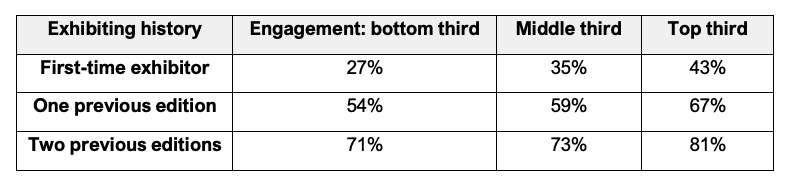
Share returning the following year, shows with two previous editions on Grip. On high-use shows the spread widens to 25% to 79%. Source: Grip.
Two readings stand out. History dominates: a first-timer in the top third returns less often (43%) than a second-year exhibitor in the bottom third (54%). Engagement then adds 10 to 16 points at every level of history. The second edition is the hurdle, and engagement is what helps exhibitors clear it.
2- The only attention that counts: attention received, not given
The most useful finding is about which engagement counts. Attention an exhibitor receives predicts its return. Effort it makes does not.
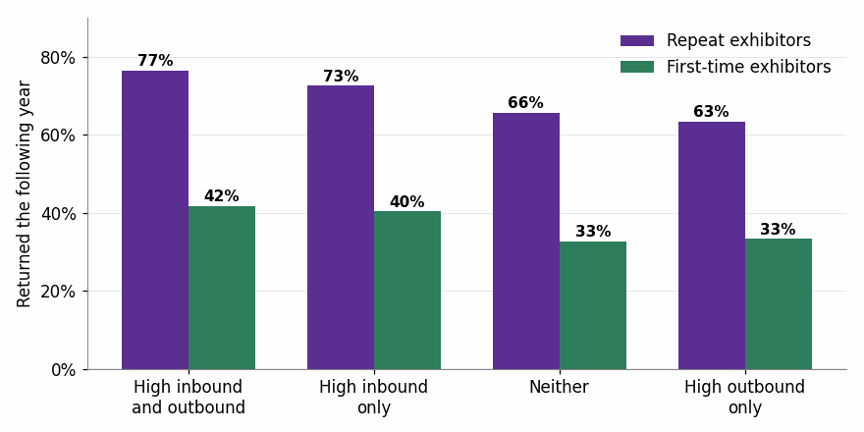
Inbound = badge scans, interested swipes and profile views received. Outbound = badge scans, swipes and profile views made, and meeting requests sent. Chart: Grip.
Repeat exhibitors high on inbound attention alone returned at 73%, close to the 77% of those high on everything. Repeats high on outbound effort alone returned at 63%, below the 66% of those who did neither. First-timers show the same shape. With every metric in the model, the outbound ones carry zero weight. Badge scans received is the strongest single signal, worth 13 points for repeats.
As Grip puts it: "An exhibitor that works the platform hard and gets little back has had a poor show, and is telling you so."
I have long described events as handshakes businesses. A handshake takes two hands. An exhibitor reaching out to a hall that does not reach back has not had a handshake, and will not pay for another. The organiser's job is to deliver attention to the stand, but exhibitor in return needs to create a profile worthy of attention, informing and inviting their potential customers.
3- You can see churn coming
Engagement and exhibiting history together give every exhibitor a return likelihood on the last day of the show, months before rebooking closes. And the likelihoods hold.
Grip fitted the model on four fifths of the show cycles and tested it on the rest, five times over. Exhibitors predicted at 17% returned at 18%; those predicted at 86% returned at 86%. The largest miss in any band is 3 points. The pattern also repeats: where the engagement effect appeared one year, it appeared again the next 89% of the time.
The risk is concentrated. The lowest-scoring 30% of exhibitors contain 45% of those who go on to churn. That is a retention team's call list, ready the week the show ends.
The study is clear about what the model does not do. It is not a verdict on a single exhibitor: as a yes/no call it is right 69% of the time, rising to 85% for exhibitors it scores below 20% or above 80%. It forecasts the total no better than last year's retention rate. And engagement is correlation, not causation. Its value is that it tells you which exhibitors, and tells you early.
Takeaways for organisers
1. Score every exhibitor at show close. Place each exhibitor in its band the week the show ends. Next year's sales cycle starts at the close of this one.
2. Measure attention received, not effort made. Weight interested swipes received, profile views received and meetings held. Give less weight to outbound activity. Flag high-effort, low-return exhibitors separately: they are telling you the show did not work for them.
3. Win the second edition. First-timers (Y1) return at 27% to 43%; one previous edition lifts that to 54% to 67%. Onboarding, matchmaking and follow-up for first-timers is the highest-return retention spend an organiser has.
4. Deliver attention to the stand. Buyer quality, hosted buyer programmes and matchmaking that routes visitors to under-visited stands are organiser levers. So is encouraging exhibitors to invite their existing customers, which only about half do.
5. Watch the band mix. A growing share of exhibitors in the low-engagement bands is an early warning, even in a year when headline retention looks fine.
The king's evidence
Retention is king because it compounds, and because every point of it is growth that needs no acquisition spend. Organisers have known that engagement drives it. Grip's study turns that knowledge into a number, available on the last day of the show, for every exhibitor on the floor.
Engagement will not decide retention on its own. Exhibiting history carries more weight. But it is the driver organisers can see earliest and move most, and the evidence that it matters is now consistent across 568 show cycles.
Next year's renewal is already won or lost on the last day of this year's show. So make sure your visitors arrive with a plan, and your exhibitors with a reason to be found.”
One question for every organiser reading this: do you know, today, which of last edition’s exhibitors won’t be back? Not the retention rate. The names.
If the honest answer is no, next year’s sales cycle is already running blind. The data is usually sitting in your platforms. Few organisers have turned it into a score at show close, a call list for sales, and a plan to win the second edition.
If you’d like to talk about where your churn is hiding before your next show closes, or other levers of organic growth, send me an email here: baris@barisonay.com
For now, here’s a Bonus tip:
Just add your Y1 exhibitors’ logos to your floorplan and mark them “new”.
My thanks to the Grip team for the early access.
Barış